

Maps. Maps make everything better. Imagine the ability to see your entire global R&D portfolio on a map. Well, how would that help me? What if it was visualized based off of the project’s facility location? What about if it was by the region affected by that project. Imagine being able to send resources or take them away from certain projects based on how they impact a particular region or country.
With Decision Lens Geo Map organizations are able to see their entire portfolio on a map that is visually scalable from a city block all the way to the entire planet. Using not only a mailing address but also longitude and latitude so no matter where a particular project is located, it will be shown. As you can see below, there are about 8 projects taking place in Europe, 4 in Japan and 4 in the USA. Is that too many projects happening in Europe? Does your company want to focus more resources elsewhere?
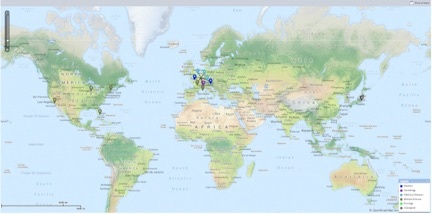
You can see the colors for each project are different. This visual shows the projects by their particular research area. Maybe your company wants to have more research areas in the USA, but currently only has one. This visual allows organizations to see their portfolio geographically and determine how that could potentially impact their decisions.
Let's get started
We have been modernizing public sector planning for 15+ years, evolving our solution to meet the needs of today while delivering the cutting-edge capabilities of tomorrow.
